Predicting Flight Delays
at Scale
Machine learning analysis of 31M+ flights to predict departure delays using weather, temporal, and historical patterns
UC Berkeley MIDS W261 - Machine Learning at Scale
The $28B Problem
Flight delays cost the U.S. economy billions annually, affecting passengers, airlines, and the broader transportation system.
Economic impact on passengers and airlines
One in five flights arrives late
Time lost per delayed flight
Missed Connections
Cascading delays across networks
Hidden Costs
Hotels, meals, rebooking fees
Lost Productivity
Business meetings and deadlines
Operational Strain
Crew scheduling, gate management
Can we predict which flights will be delayed before they depart?
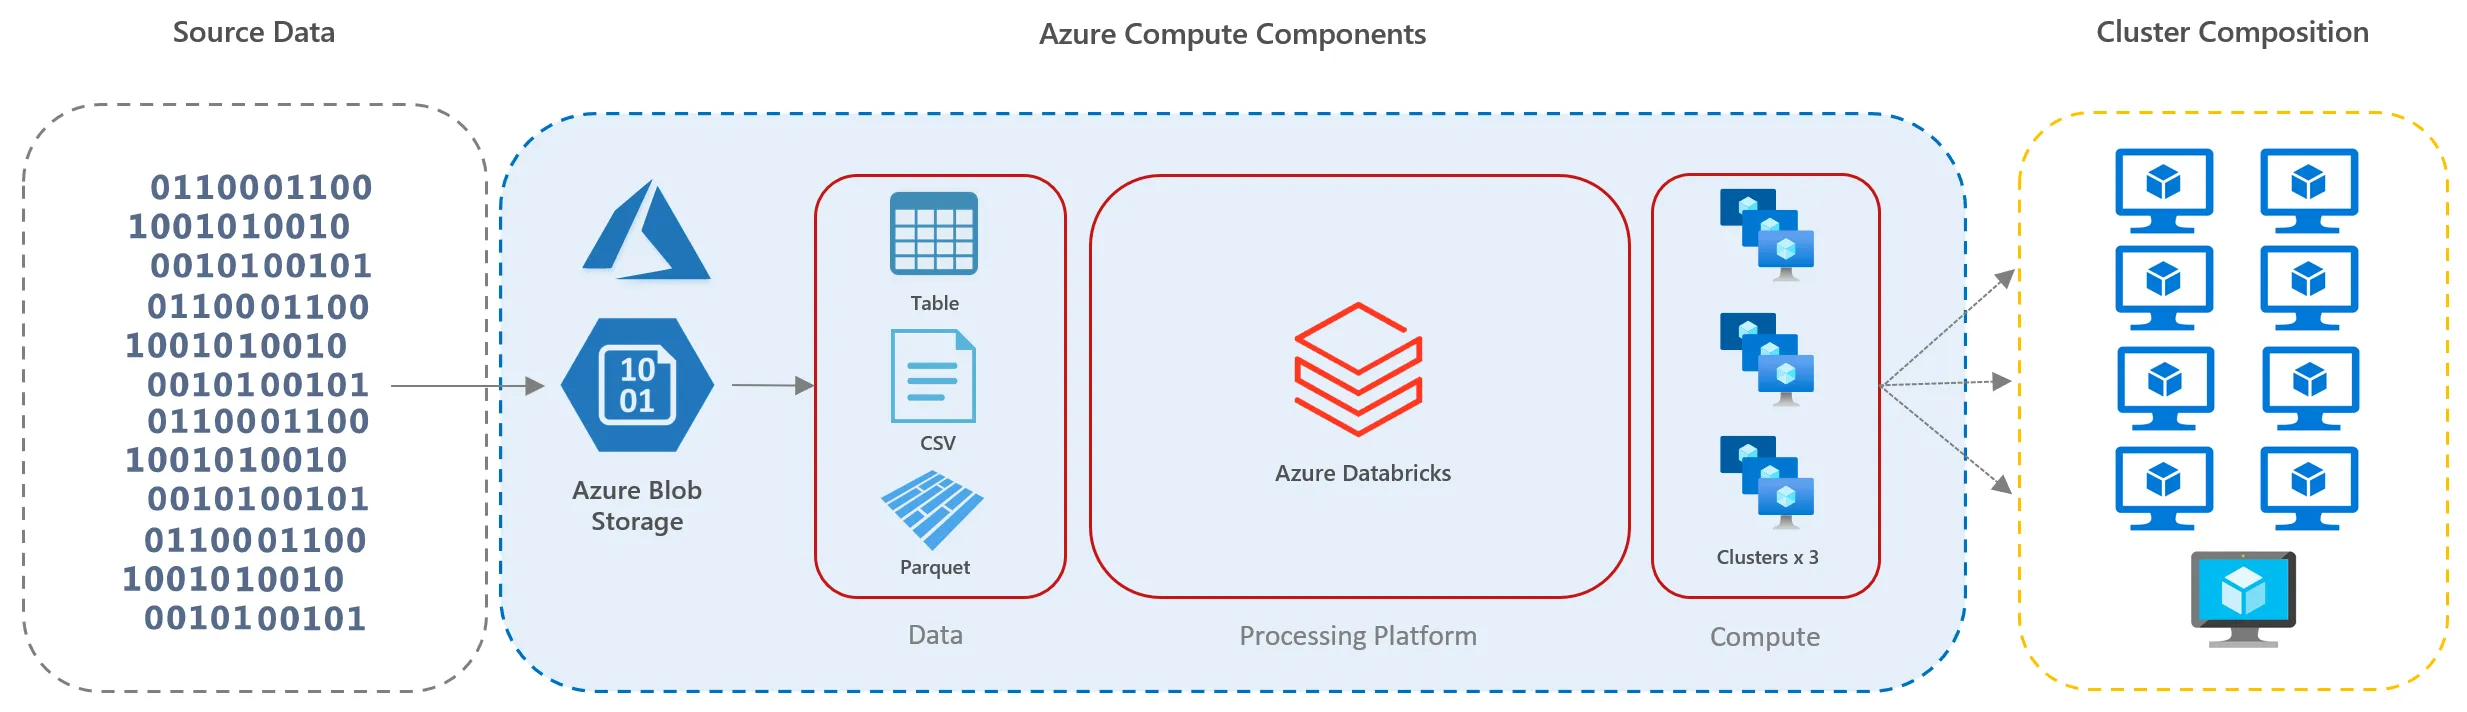
The Data
Combining flight records, weather observations, and station metadata to build a comprehensive prediction model.
Flights
records
- Period: 2015-2019
- Fields: 109 columns
- Target: DEP_DEL15
Weather
observations
- Stations: 630 mapped
- Frequency: Hourly
- Features: Wind, Vis, Temp
Stations
weather stations
- Mapped: 630 to airports
- Coverage: Continental US
- Matching: Nearest station
Discovery
Exploring patterns in 31 million flights to uncover what drives delays.
Which Airlines Delay Most?
Delay rates vary significantly across carriers. Frontier and JetBlue show the highest delay percentages, while Hawaiian Airlines performs best. This suggests operational factors beyond weather play a significant role.
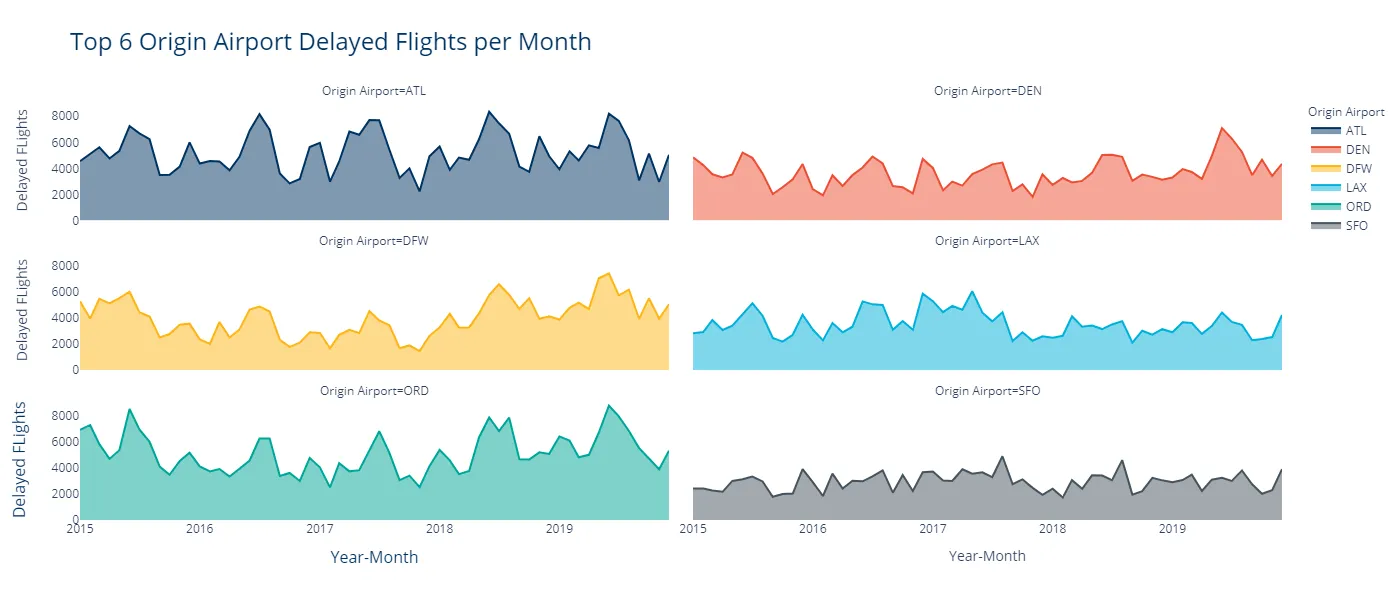
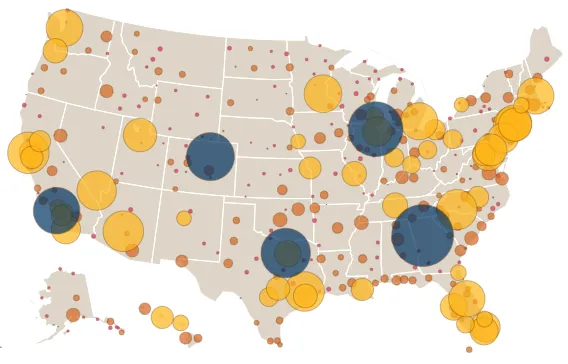
Geographic Patterns
Flight volume concentrates around major hubs: Atlanta, Chicago O'Hare, Dallas-Fort Worth, Denver, and Los Angeles. These hub airports see the most flights but also experience cascading delay effects.
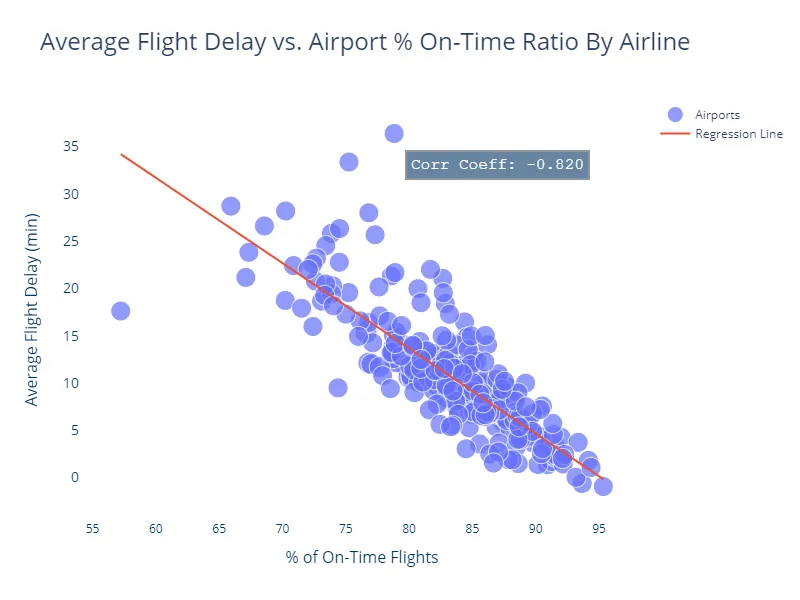
The Correlation Story
Feature correlation analysis reveals which variables have the strongest relationships with delays. Previous flight delays show the highest correlation—a delayed inbound flight means a delayed outbound.
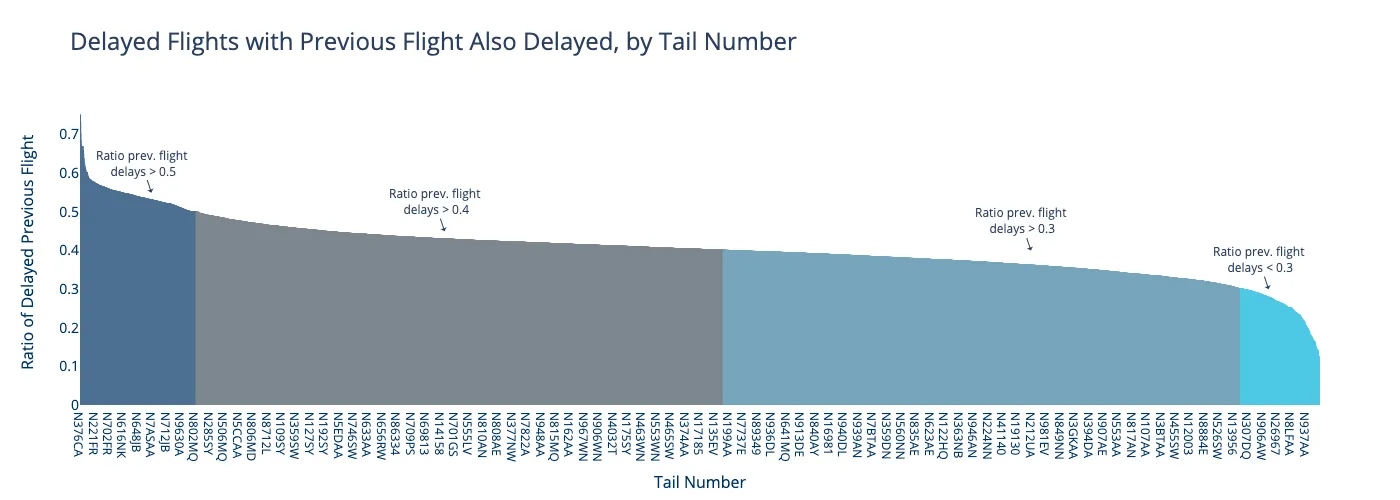
The Previous Flight Effect
The strongest predictor of delay is whether the previous flight on the same aircraft was delayed. This single feature captures operational dependencies that weather data alone cannot explain.
Armed with these insights, we designed a prediction pipeline.
The Approach
A scalable machine learning pipeline built on PySpark and TensorFlow.
Solution Architecture
Feature Engineering
From 35 candidate features, we selected the top 6 based on importance analysis. These features capture 94% of the predictive power while reducing computational complexity.
Selected Features
- 1 DEP_DEL15_PREV
- 2 CRS_DEP_TIME_bucket
- 3 OD_GROUP
- 4 wnd_speed
- 5 vis_distance
- 6 dest_tmp
Feature Insights
DEP_DEL15_PREV Previous flight delay status—our most powerful predictor
CRS_DEP_TIME_bucket Scheduled departure time binned into operational periods
OD_GROUP Origin-destination pair encoding route characteristics
wnd_speed, vis_distance, dest_tmp Weather conditions at departure and arrival airports
Model Selection
Logistic Regression
Baseline model with L2 regularization. Fast training, interpretable coefficients.
BaselineRandom Forest
Ensemble of 100 trees with max depth 10. Best balance of performance and speed.
Best F1Neural Network
Feed-forward network with 3 hidden layers. TensorFlow on GPU for training.
Deep LearningData Engineering Pipeline
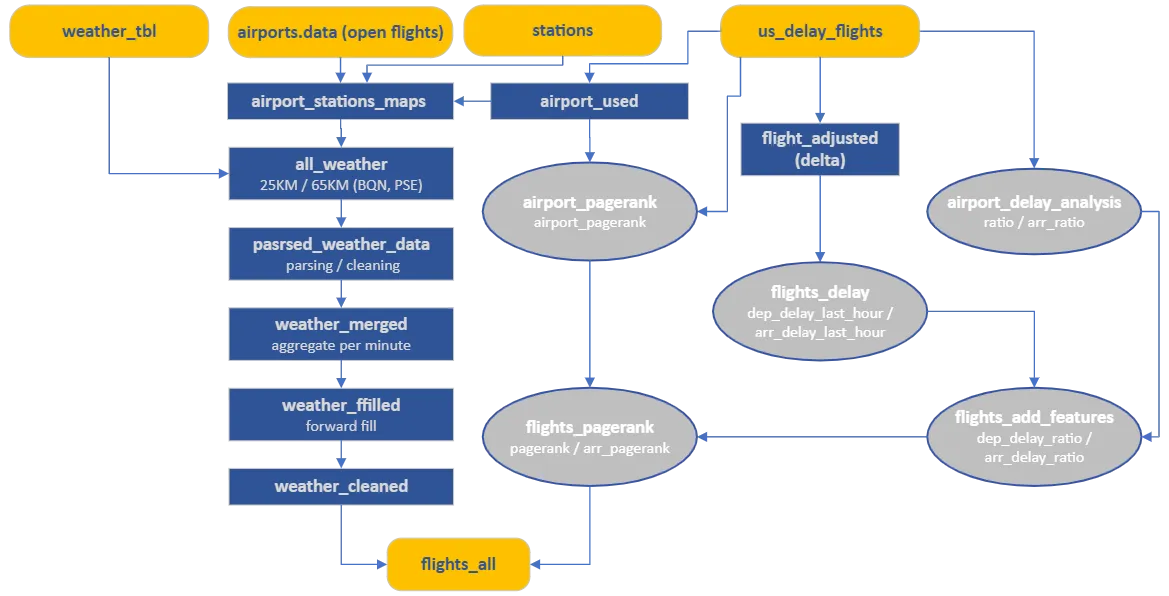
Results
Comparing model performance on predicting flight delays 2 hours before departure.
| Model | F1 Score | AUC-ROC | Strengths |
|---|---|---|---|
| Logistic Regression | 0.41 | 0.70 | Fast, interpretable |
| Random Forest | 0.44 | 0.72 | Best balance |
| Neural Network | 0.49 | 0.73 | Highest AUC |
Top 6 features achieve 94% of full model performance
Feature selection reduced training time by 85% while maintaining predictive accuracy.
Top Feature Importance
DEP_DEL15_PREV 17.2% CRS_DEP_TIME_bucket 14.8% OD_GROUP 13.1% wnd_speed 11.5% vis_distance 10.2% dest_tmp 8.7% Understanding the Metrics
F1 Score
Harmonic mean of precision and recall. Balances catching delays (recall) with avoiding false alarms (precision).
AUC-ROC
Area under the receiver operating curve. Measures model's ability to distinguish delayed from on-time flights.
Why These Matter
Imbalanced classes (20% delays) make accuracy misleading. F1 and AUC provide more meaningful evaluation.