Analysis of Criminal Statistics in North Carolina
UC Berkeley | Statistics for Data Science
With Kevin Kory and Joy First
Project Description
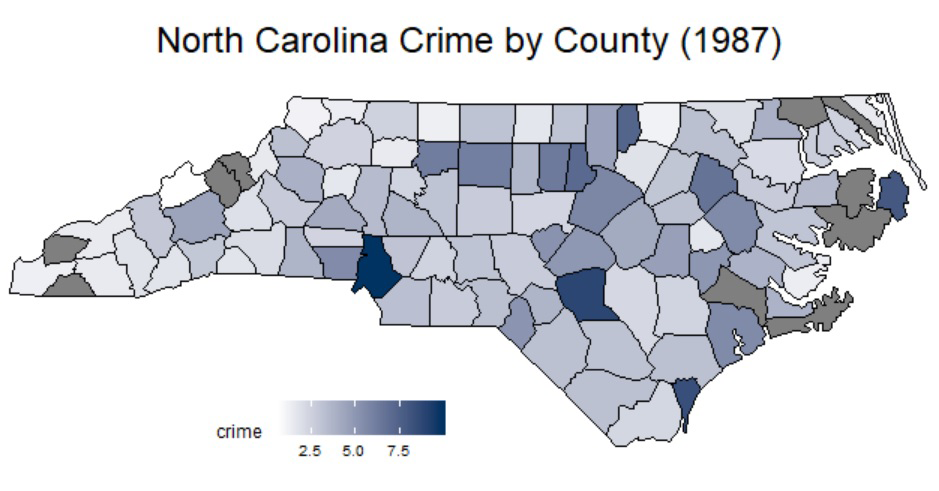
A deep-dive analysis of criminial statistics in North Carolina, circa 1987, and persuasive argumentation for policymakers on actions likely to result in the diminution of county-level and state-level criminal behavior.
Skills
Data Analysis, Data Cleaning, Linear Regression, Statistical Inference, Written Communication, Decision Support
Tools
R, LaTeX, ggplot, Plotly, Jupyter
Motivation
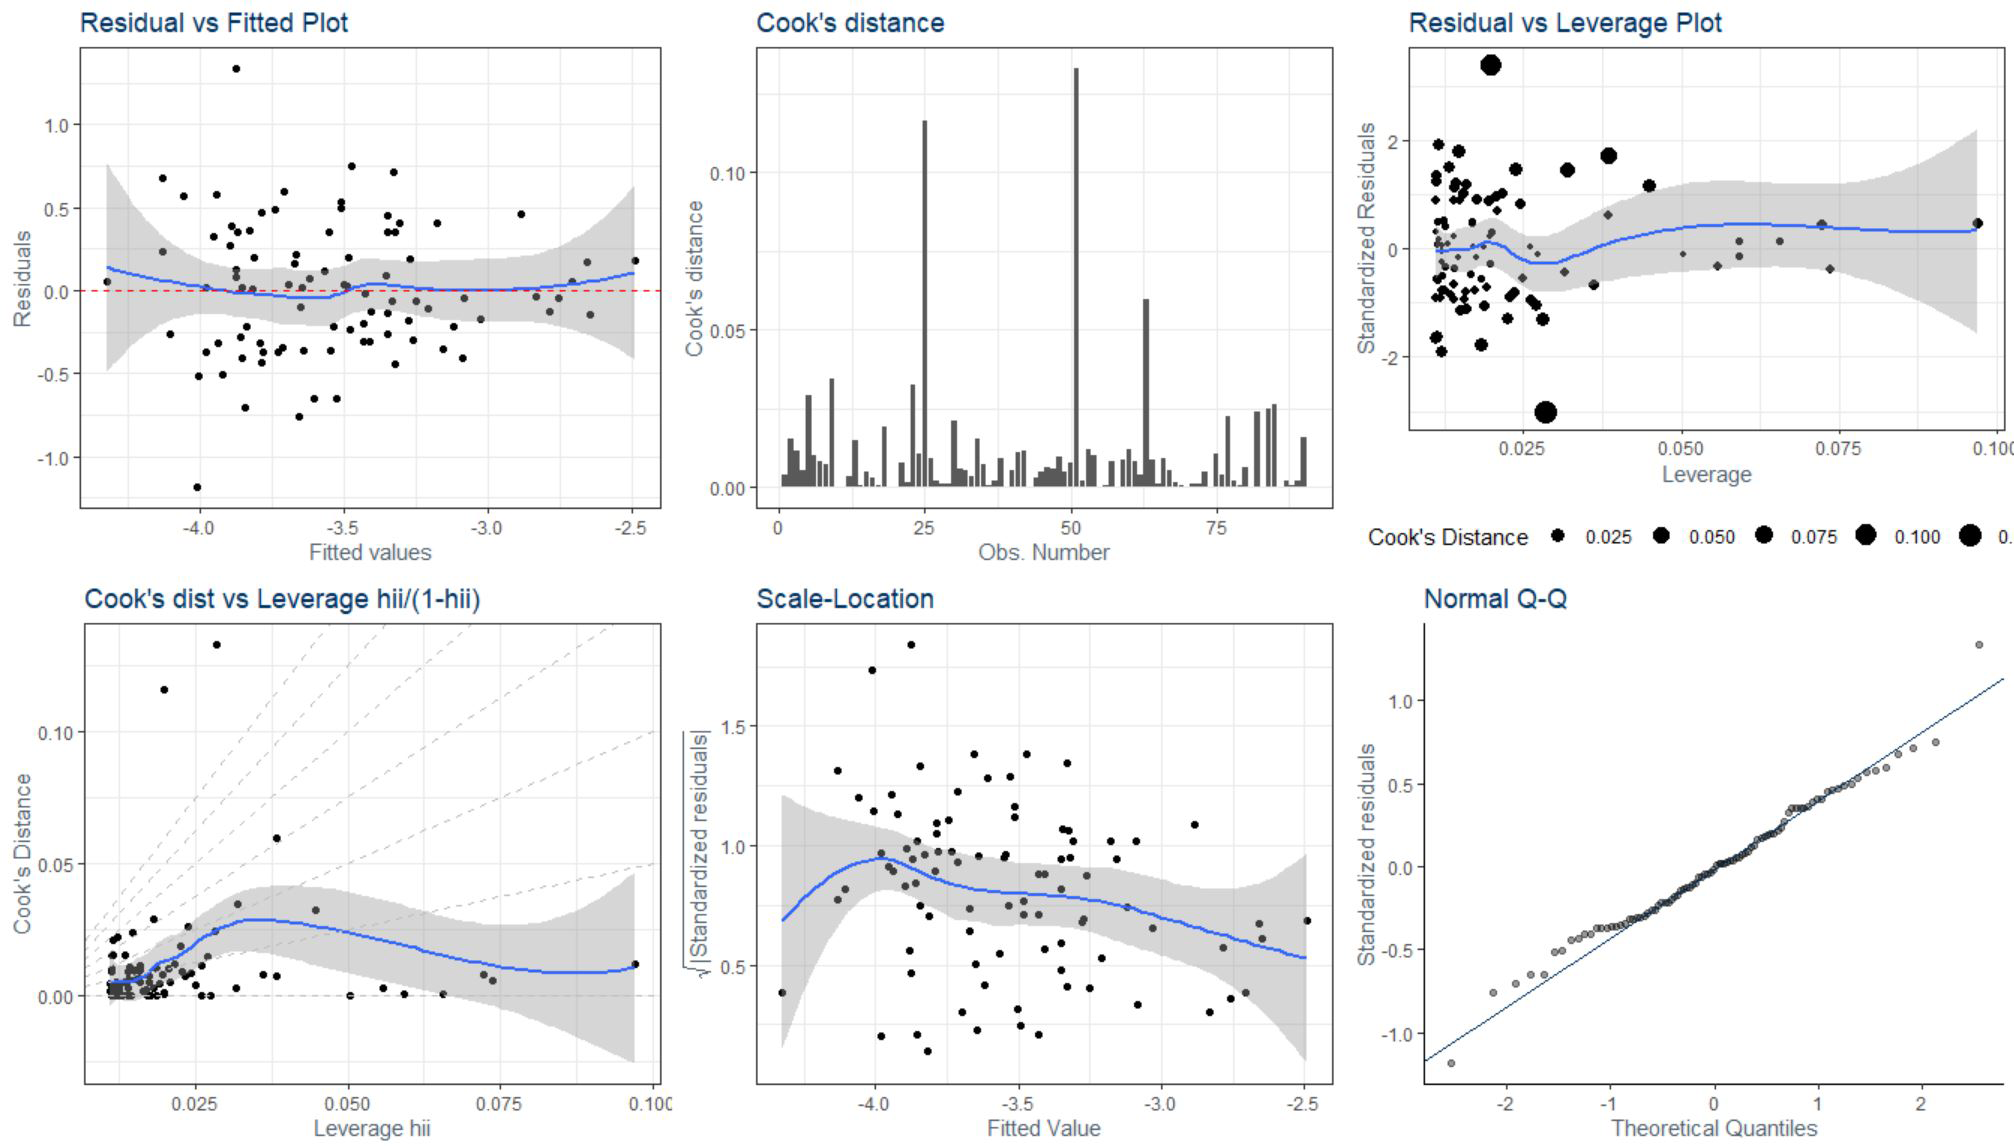
Crime and it's predictive signals are complicated. The final project for the Fall 2019 semester of U.C. Berkeley graduate data science course (W203) asked us to conduct a deep-dive analysis on criminal statistics from North Carolina as captured in 1987, to prepare and evaluate the effectiveness of linear models on said data, and to provide policymakers with a set of data-driven recommendations.
The agenda of the group assignment was to evaluate student effectiveness in dealing with a wide range of common patterns when applying a statistical treatment to a problem: critically applying the concepts of statitics to data analysis, identifying and treating errata, cleverly leveraging outside resources without guidance, constructing linear models, identify assumptions and recognizing when they are violated, dealing with overfitting, and providing a persuasive argument to decision makers about what actions to take in a well-informed manner.
The final subssion for our documentation and summary presentation is available here. The GitHub repo for our project contains all code artifacts, including LaTeX, R, and source data. This assignment received a near perfect score - omitting only one insight about the IID nature of the 10 missing counties, and was instrumental in my receiving an A+ grade for the semester.
See the complete project in my GitHub repository.